Today, the Reserve Bank released the results of January 2025 round of its bi-monthly consumer confidence survey (CCS)1. The survey collects current perceptions (vis-à-vis a year ago) and one year ahead expectations of households on general economic situation, employment scenario, overall price situation, own income and spending across 19 major cities. The latest round of the survey was conducted during January 2-11, 2025, covering 6,081 respondents. Female respondents accounted for 52.4 per cent of this sample. Highlights: -
Consumer confidence for the current period marginally declined owing to somewhat tempered sentiments across the survey parameters except price level; the current situation index (CSI)2 moderated by 0.3 point to 93.7 in January 2025 (Chart 1; Tables 1, 2, 3, 5 and 6). -
Households’ assessment on one-year ahead outlook remained firmly in the optimistic territory though their sentiments on major parameters moderated at the aggregate level; the future expectations index (FEI) declined by 1.2 points to 120.7 in the latest survey (Chart 1; Tables 1, 2, 3, 5 and 6). -
Respondents indicated lower pessimism regarding prevailing price levels and inflation when compared to the previous survey round. For the coming year, however, households expect both prices and inflation to inch up (Tables 3 and 4). -
The survey manifested subdued sentiments on spending for both essential and non-essential outlays vis-à-vis the November 2024 round. Despite some moderations, the sentiments about future spending remains strong (Tables 6, 7 and 8). 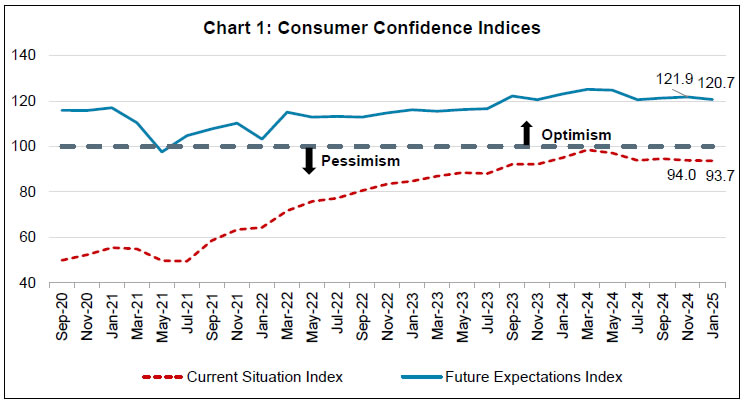
Note: Please see the excel file for time series data3
| Table 1: Perceptions and Expectations on the General Economic Situation | | (Percentage responses) | | Survey Round | Current Perception | One year ahead Expectation | | Increased | Remained Same | Decreased | Net Response | Will Increase | Will Remain Same | Will Decrease | Net Response | | Jan-24 | 37.5 | 22.3 | 40.2 | -2.7 | 59.2 | 15.3 | 25.5 | 33.7 | | Mar-24 | 41.2 | 23.1 | 35.8 | 5.4 | 60.7 | 15.8 | 23.4 | 37.3 | | May-24 | 40.0 | 22.6 | 37.4 | 2.6 | 59.0 | 15.6 | 25.4 | 33.5 | | Jul-24 | 36.3 | 22.4 | 41.3 | -5.0 | 55.0 | 16.0 | 29.0 | 26.1 | | Sep-24 | 37.3 | 21.1 | 41.6 | -4.4 | 55.5 | 16.0 | 28.6 | 26.9 | | Nov-24 | 35.8 | 21.3 | 42.9 | -7.1 | 54.9 | 17.2 | 27.9 | 27.0 | | Jan-25 | 34.9 | 22.1 | 43.0 | -8.0 | 55.2 | 15.8 | 29.0 | 26.2 |
| Table 2: Perceptions and Expectations on Employment | | (Percentage responses) | | Survey Round | Current Perception | One year ahead Expectation | | Increased | Remained Same | Decreased | Net Response | Will Increase | Will Remain Same | Will Decrease | Net Response | | Jan-24 | 35.3 | 23.4 | 41.3 | -6.0 | 58.7 | 17.4 | 24.0 | 34.7 | | Mar-24 | 38.1 | 23.8 | 38.1 | -0.0 | 60.0 | 17.4 | 22.6 | 37.4 | | May-24 | 36.8 | 23.0 | 40.2 | -3.3 | 58.0 | 18.3 | 23.7 | 34.3 | | Jul-24 | 34.5 | 23.0 | 42.6 | -8.1 | 54.2 | 18.4 | 27.4 | 26.8 | | Sep-24 | 35.5 | 21.8 | 42.8 | -7.3 | 54.2 | 18.9 | 26.9 | 27.3 | | Nov-24 | 34.6 | 23.0 | 42.4 | -7.8 | 54.6 | 18.9 | 26.5 | 28.1 | | Jan-25 | 34.5 | 22.7 | 42.7 | -8.2 | 54.7 | 18.3 | 27.0 | 27.6 |
| Table 3: Perceptions and Expectations on Price Level | | (Percentage responses) | | Survey Round | Current Perception | One year ahead Expectation | | Increased | Remained Same | Decreased | Net Response | Will Increase | Will Remain Same | Will Decrease | Net Response | | Jan-24 | 90.8 | 7.2 | 2.0 | -88.9 | 80.5 | 10.4 | 9.1 | -71.4 | | Mar-24 | 89.2 | 9.3 | 1.4 | -87.8 | 78.2 | 12.5 | 9.4 | -68.8 | | May-24 | 90.5 | 7.8 | 1.6 | -88.9 | 79.0 | 10.4 | 10.6 | -68.4 | | Jul-24 | 93.3 | 6.0 | 0.7 | -92.6 | 82.7 | 8.9 | 8.4 | -74.3 | | Sep-24 | 93.3 | 5.8 | 0.9 | -92.4 | 82.0 | 9.5 | 8.6 | -73.3 | | Nov-24 | 94.3 | 5.0 | 0.7 | -93.6 | 82.3 | 9.2 | 8.5 | -73.8 | | Jan-25 | 93.0 | 6.1 | 0.9 | -92.0 | 83.0 | 9.2 | 7.9 | -75.1 |
| Table 4: Perceptions and Expectations on Rate of Change in Price Level (Inflation)* | | (Percentage responses) | | Survey Round | Current Perception | One year ahead Expectation | | Increased | Remained Same | Decreased | Net Response | Will Increase | Will Remain Same | Will Decrease | Net Response | | Jan-24 | 79.5 | 15.7 | 4.8 | -74.7 | 77.2 | 17.8 | 5.0 | -72.2 | | Mar-24 | 77.0 | 17.6 | 5.4 | -71.6 | 76.7 | 18.3 | 5.0 | -71.7 | | May-24 | 77.8 | 15.1 | 7.1 | -70.6 | 79.1 | 16.0 | 4.9 | -74.3 | | Jul-24 | 80.6 | 13.4 | 6.1 | -74.6 | 79.4 | 16.2 | 4.4 | -75.0 | | Sep-24 | 80.7 | 13.0 | 6.2 | -74.5 | 78.7 | 15.9 | 5.4 | -73.4 | | Nov-24 | 82.5 | 12.1 | 5.4 | -77.2 | 79.3 | 15.1 | 5.7 | -73.6 | | Jan-25 | 80.7 | 12.9 | 6.5 | -74.2 | 79.9 | 14.5 | 5.7 | -74.2 | | *Applicable only for those respondents who felt price has increased/price will increase. |
| Table 5: Perceptions and Expectations on Income | | (Percentage responses) | | Survey Round | Current Perception | One year ahead Expectation | | Increased | Remained Same | Decreased | Net Response | Will Increase | Will Remain Same | Will Decrease | Net Response | | Jan-24 | 26.4 | 51.5 | 22.1 | 4.2 | 56.3 | 36.9 | 6.8 | 49.4 | | Mar-24 | 27.7 | 50.6 | 21.7 | 6.0 | 56.7 | 37.2 | 6.1 | 50.5 | | May-24 | 25.3 | 52.3 | 22.4 | 2.9 | 56.9 | 36.9 | 6.2 | 50.7 | | Jul-24 | 24.4 | 50.8 | 24.9 | -0.5 | 55.9 | 37.3 | 6.8 | 49.1 | | Sep-24 | 24.1 | 51.6 | 24.3 | -0.3 | 55.8 | 38.2 | 6.0 | 49.9 | | Nov-24 | 23.8 | 51.7 | 24.5 | -0.7 | 56.6 | 37.1 | 6.4 | 50.2 | | Jan-25 | 22.0 | 55.0 | 23.0 | -1.0 | 55.9 | 37.4 | 6.8 | 49.1 |
| Table 6: Perceptions and Expectations on Spending | | (Percentage responses) | | Survey Round | Current Perception | One year ahead Expectation | | Increased | Remained Same | Decreased | Net Response | Will Increase | Will Remain Same | Will Decrease | Net Response | | Jan-24 | 73.2 | 22.3 | 4.5 | 68.6 | 74.2 | 20.9 | 5.0 | 69.2 | | Mar-24 | 73.1 | 23.1 | 3.8 | 69.2 | 73.9 | 21.7 | 4.3 | 69.6 | | May-24 | 76.2 | 20.1 | 3.8 | 72.5 | 77.9 | 18.1 | 4.0 | 73.9 | | Jul-24 | 78.9 | 18.0 | 3.1 | 75.8 | 79.5 | 16.5 | 3.9 | 75.6 | | Sep-24 | 80.4 | 16.9 | 2.7 | 77.6 | 79.6 | 16.9 | 3.6 | 76.0 | | Nov-24 | 80.9 | 17.2 | 1.9 | 79.0 | 80.8 | 16.4 | 2.8 | 78.0 | | Jan-25 | 79.3 | 19.4 | 1.3 | 77.9 | 78.8 | 18.3 | 2.9 | 75.9 |
| Table 7: Perceptions and Expectations on Spending - Essential Items | | (Percentage responses) | | Survey Round | Current Perception | One year ahead Expectation | | Increased | Remained Same | Decreased | Net Response | Will Increase | Will Remain Same | Will Decrease | Net Response | | Jan-24 | 84.1 | 12.9 | 3.0 | 81.1 | 81.8 | 14.6 | 3.6 | 78.2 | | Mar-24 | 84.5 | 13.0 | 2.5 | 82.0 | 82.5 | 14.5 | 3.0 | 79.5 | | May-24 | 85.6 | 11.8 | 2.7 | 82.9 | 84.7 | 12.3 | 3.1 | 81.6 | | Jul-24 | 87.3 | 10.5 | 2.2 | 85.1 | 85.0 | 12.1 | 2.9 | 82.0 | | Sep-24 | 87.9 | 10.3 | 1.8 | 86.2 | 84.9 | 12.4 | 2.7 | 82.2 | | Nov-24 | 88.6 | 9.7 | 1.7 | 86.9 | 85.9 | 11.5 | 2.6 | 83.3 | | Jan-25 | 87.6 | 10.9 | 1.6 | 86.0 | 85.1 | 12.3 | 2.6 | 82.5 |
| Table 8: Perceptions and Expectations on Spending - Non-Essential Items | | (Percentage responses) | | Survey Round | Current Perception | One year ahead Expectation | | Increased | Remained Same | Decreased | Net Response | Will Increase | Will Remain Same | Will Decrease | Net Response | | Jan-24 | 27.2 | 36.2 | 36.6 | -9.4 | 34.6 | 36.4 | 29.0 | 5.5 | | Mar-24 | 29.2 | 37.6 | 33.2 | -4.1 | 35.7 | 37.6 | 26.7 | 9.0 | | May-24 | 30.5 | 35.4 | 34.1 | -3.7 | 37.4 | 35.2 | 27.4 | 9.9 | | Jul-24 | 29.0 | 36.7 | 34.4 | -5.4 | 37.4 | 35.6 | 27.0 | 10.3 | | Sep-24 | 27.6 | 40.2 | 32.3 | -4.7 | 36.4 | 37.8 | 25.8 | 10.6 | | Nov-24 | 30.2 | 37.2 | 32.6 | -2.4 | 38.4 | 35.0 | 26.6 | 11.8 | | Jan-25 | 29.2 | 38.5 | 32.3 | -3.1 | 37.4 | 36.1 | 26.5 | 11.0 |
|